

Simulation of a Drive Through Covid Vaccination
The Covid-19 pandemic, which began in Europe in 2020, has generated numerous efforts by society and organizations to reach an end. In most recent months and with the vaccine already on the market to be administered, a solution is already being seen for the problem that affects the whole society. Many say that the faster the vaccine is distributed and administered to people, the sooner we can reopen all the restrictions that people face and as such, it is necessary to discover and analyze ways of distribution and vaccination that are fast and efficient.
Simulation tools are a great way to discover the best paths and decisions to implement about this. We can simulate the flows of people and vaccines, interacting with different external variables, so that we can decide and implement the solutions that bring the best and fastest results. The case of a drive-through for Covid-19 vaccination is one of the possibilities that many speak of as one of the best to implement because it does not overload existing health facilities and prevents the spread of the virus.
The simulation performed of the drive-through aims to show what are the best decisions to implement in it, from the point of view of process, flows of people and materials, so we can get the best output on the numbers of people vaccinated and we can scale the site for the results we want. Thus, this drive-through has 10 possible vaccination lines, an initial screening area, a registration area, a vaccination area and finally a rest area after vaccination. The times for each of the areas display different statistical functions, but with the minimum and maximum values below:
- Screening time [15s to 60s]
- Registration time [2m to 7m]
- Vaccination time [2m to 7m]
- Rest time [5m to 10m]
There are many variables that can be analyzed to understand the results of changes on the model, but in this case, we will look only at the existence of queues for vehicles with multiple people and other queues for vehicles with few people. When we make the simple choice of allocating vehicles depending on their occupation, the amount of people vaccinated can increase by 28%! As can be seen in the results below, both the number of people vaccinated increases considerably and for example the waiting times of people in vehicles also reduce about 50%.
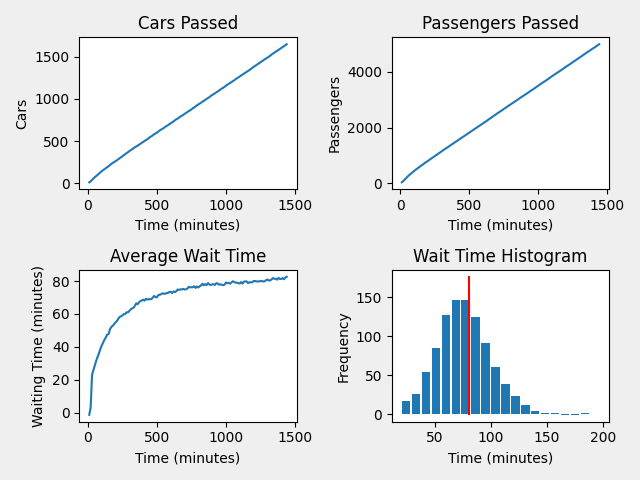
Fig.1 - Results without queues for different degrees of vehicle occupancy
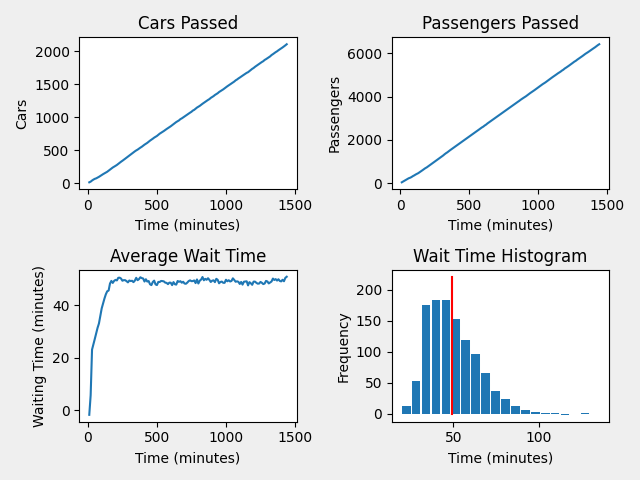
Fig.2 - Results with queues for different degrees of vehicle occupancy
These are very important results and data for making decisions regarding vaccination for Covid-19 and on people and material flows in general. With 10 drive-through scans like those presented, working 24 hours a day, we could have the population of Portugal vaccinated in 6 months. Not only in this example, but in health units in general, it is important to have analyses that can bring the best results to the population and in an efficient way. Slefty, with its simulation team, can give you real data for the decisions to be made and help society find better solutions to the resolution of the Covid-19 pandemic.